Quick answer
- Together, these metrics show how hard you worked, how your body handled it, and whether you should push, hold, or recover.
- Heart rate and zones show live training stress.
- Internal load reflects how costly a session felt.
In this article · 12 sections
If You Want Steadier Training, Watch These Five Signals: Heart Rate, HRV, Internal Load, External Load, and Recovery Fatigue Markers
Together, these metrics show how hard you worked, how your body handled it, and whether you should push, hold, or recover.
Here’s the short version:
- Heart rate and zones show live training stress.
- HRV indicates day-to-day readiness.
- Internal load reflects how costly a session felt.
- External load reveals what work got done.
- Recovery and neuromuscular fatigue indicate if the body is still carrying strain.
A few numbers matter right away: a resting heart rate 5 bpm above baseline, HRV staying 15% below normal, or a 5% to 15% drop in jump height can all point to fatigue. If low HRV, high resting heart rate, and poor sleep last for 3+ days, it’s usually time to cut back.
Quick Comparison
| Metric | What it tells me | Common red flag | Usual coaching move |
|---|---|---|---|
| Heart Rate & Zones | Live effort level | Heart rate climbs while pace/power stays flat | Slow down or stay in target zone |
| HRV | Readiness and stress | Lower 7-day trend, higher day-to-day swing | Lower intensity or deload |
| Internal Load | How hard the session felt | sRPE goes up without more output | Check fatigue, sleep, illness, or life stress |
| External Load | Work done | Output drops or ACWR gets too high | Trim volume, sprint work, or intensity |
| Recovery / Neuromuscular Fatigue | Whether the body has bounced back | Lower CMJ, poor sleep, high soreness | Recovery day, light Zone 1 to 2 work, or rest |
In other words: one metric can mislead you. But when these five are read together, it gets much easier to decide what to do next.
Why These Metrics Matter for Performance Consistency
No single metric tells the full story. HRV can show autonomic status, but it won’t tell you much about musculoskeletal fatigue. GPS distance can show output, but not the internal cost of that work. Feedback systems pull these signals together to cover those gaps. That’s how they catch performance drift before it turns into day-to-day inconsistency.
And that matters because the exact same workout can tell very different stories depending on what you read: the heart, the workload, or the recovery signal. The value shows up when internal and external data move in the same direction. If heart rate or perceived exertion goes up while output stays flat, efficiency is slipping.
Context matters just as much as the metric itself. These systems work best when they compare an athlete to their own normal, not to team averages or population benchmarks. That’s why athlete-specific algorithms tend to work better. A good rule of thumb is to track 30 to 60 days of personal data before making major training changes. One bad day is just noise. But three straight days of lower HRV and higher resting heart rate point to a pattern.
Sport context matters too, because recovery doesn’t happen on one neat schedule. Autonomic recovery can take hours. Muscle recovery usually takes 24 to 72 hours. Endocrine recovery can take days or even weeks. So one metric may look fine while another still shows strain.
That body-timeline view shapes how coaches read the data, especially later metrics like recovery status and neuromuscular fatigue. The numbers help coaches decide when to push, when to ease off, and when recovery needs to come first, often using post-workout recovery methods like contrast therapy.
The five metrics below show how systems turn that recovery logic into daily decisions.
1. Heart Rate and Time in Heart Rate Zones
Heart rate is the clearest live signal of training stress. Pace and distance show the work itself. Together, they give you the full picture.
Feedback systems pull this data from wrist, chest, or arm wearables and sort it into five zones, from Z1 to Z5, based on a percentage of an athlete’s max heart rate or lactate threshold. In the moment, that matters a lot. You can see when effort starts to drift past the plan instead of finding out after the session is done.
Zone tracking helps confirm that a workout stays inside the target load. A run meant for Zone 2 can slowly slide into Zone 3 or 4, which adds fatigue that wasn’t part of the day’s goal. On low-readiness days, Zones 1 to 2 make more sense. On high-readiness days, athletes can take on more time in the upper zones.
What coaches tend to watch most is the efficiency ratio. If heart rate goes up while pace or power stays the same, stress is climbing faster than output. That’s often a sign of dehydration, heat stress, or an illness that’s starting to creep in. A resting heart rate that sits 5 bpm or more above an athlete’s own 30-day average is also a strong sign of incomplete recovery.
When heart rate changes without a matching shift in output, that’s usually the moment to check readiness more closely. Heat, hydration, and caffeine can all skew heart-rate readings. Heart rate tells you the load. HRV tells you whether the body is ready for more.
2. Heart Rate Variability (HRV)
HRV shifts the focus from output to readiness. Put simply, HRV is the small change in time between one heartbeat and the next. Most feedback systems measure it with RMSSD during sleep or early in the morning.
This number points to the balance between the sympathetic ("fight-or-flight") and parasympathetic ("rest-and-digest") branches of the autonomic nervous system. High HRV usually means more parasympathetic dominance, which suggests the body is recovered and ready for hard training. Low HRV can point to built-up fatigue, life stress, illness, or overtraining. HRV reflects stress from training, sleep loss, illness, and day-to-day life load.
What coaches usually watch isn't just one daily score. They look at a 7-day rolling average and the coefficient of variance (CV), which shows how steady or jumpy the numbers are over time. When CV starts widening while the average keeps dropping, that's a red flag for overreaching and often leads to an immediate deload. Most systems boil HRV down into simple readiness signals:
- Green for hard work
- Yellow for moderate training
- Red for recovery
HRV works best when you use it with resting heart rate and movement metrics. On its own, HRV can miss tissue strain. Paired with movement data, it gives a clearer picture. If HRV is low and resting heart rate is up by 5 bpm or more, that's usually a sign the athlete needs to back off.
HRV shows readiness. Internal training load shows how costly the session was.
3. Internal Training Load
Internal training load shows how much a session costs the body. The most common way to track it is session RPE (sRPE). The athlete rates the session on a 1 to 10 effort scale, and that score is multiplied by the session length in minutes. So if a workout lasts 60 minutes and feels like a 7, the sRPE is 420. Simple math, but it tells coaches a lot.
One big reason coaches use it: it's low-cost and easy to run at scale. Research also shows that RPE is one of the most commonly used monitoring tools among high-performance coaches, and many prefer it over expensive lab testing.
Where this gets more useful is when coaches compare internal load with external load. External load is the work the athlete actually does, like distance covered, speed, or total reps. Put those side by side and patterns start to show up fast. If sRPE goes up but external output stays the same, the athlete is working harder to produce the same result. The body is paying more for the same job.
That gap between cost and output is why coaches look at internal and external load together. It helps them make training changes in real time instead of waiting until fatigue turns into a bigger issue. Internal load also picks up stress that doesn't come from training alone. Travel, work, illness, and alcohol can all push it up, which is why a single bad day usually means less than the bigger pattern. Coaches often compare daily scores against a 30 to 60 day baseline to make sense of what’s normal for that athlete. That comparison sets up external load and movement intensity.
4. External Load and Movement Intensity
Once you know the cost, the next thing to look at is output. External load is the work an athlete can produce and measure. That includes distance covered, top speed, acceleration bursts, jump height, and power output in watts. Tools like GPS units, accelerometers, force plates, and power meters track these outputs and feed them back to coaches in plain numbers.
Here’s the basic split:
- GPS tracks distance and speed.
- Accelerometers record acceleration and change of direction.
- Force plates and jump mats measure jump height and reactive strength.
- Power meters show work rate in cycling, rowing, and running.
A 5% to 15% drop in CMJ height is often a sign of fatigue. That matters because these numbers show whether an athlete is producing the same amount of work with the same efficiency from one day to the next. If the output is there, great. If not, something’s off.
One metric coaches often use here is the Acute:Chronic Workload Ratio (ACWR). It compares recent load to a four-week baseline. An ACWR above 1.5 is a warning sign for higher injury risk, while 0.8 to 1.3 is the range most people use as the target zone.
The pattern to watch is pretty simple: if output stays the same but strain goes up, efficiency is slipping. That mismatch is one of the clearest signs that movement intensity is getting ahead of recovery. And when load stays high while output starts to drop, recovery status is usually the next place to look.
5. Recovery Status, Muscle Strain, and Neuromuscular Fatigue
When performance drops but fatigue stays high, recovery data usually shows what's going on. Recovery status rolls HRV, resting heart rate, and sleep into one readiness score. Muscle strain points to tissue damage, low fuel, and soreness. Neuromuscular fatigue tends to show up as lower power output and slower reaction time. For coaches, these signals help answer a simple question: Can this athlete come back tomorrow and still produce good work?
The tricky part is that these markers don't bounce back on the same schedule. One metric can look green while another is still flashing red. So an athlete may seem fine in one system and still be carrying strain somewhere else.
A 10% drop in countermovement jump (CMJ) height from baseline is a stronger fatigue signal than a single biomarker. Creatine Kinase (CK) levels above 300% of an individual's baseline are tied to a higher injury risk over the next 7 to 14 days. When those signs show up, coaches should trade intensity for mobility work or easy Zone 1-2 training. Back off now.
Use the readiness score to set the day's load:
- Green (75% to 100%): push hard.
- Yellow (50% to 74%): cut volume.
- Red: rest or do active recovery only.
If low HRV, high resting heart rate, and poor sleep stick around for three or more days, it's time to deload. These same signals also shape the next recovery session. That choice affects whether the athlete's next block is hard training, light movement, or full recovery.
How Recovery Sessions Connect to the Data
Recovery sessions don't have to be a guessing game. HRV, internal load, and readiness scores can help you see if a session actually did its job. The simplest way to track that is with a pre- and post-session readiness score. Before you get into a cold plunge or infrared sauna, rate how ready you feel on a 0 to 10 scale. Then do the same thing right after. If your post-session score is lower, that's a good sign the session helped move your body in the right direction.
For active recovery, research suggests aiming for an RPE of 3 to 4. That level can help circulation without adding extra physiological stress. If your post-session score is still high, the session was probably too much for your fatigue level that day. That gives you something concrete to track instead of going off vibes alone.
HRV is the clearest signal over time. Structured recovery methods like cold exposure and contrast therapy can restore HRV 24 to 48 hours sooner than passive rest. If HRV stays more than 15% below your personal baseline after a session, cut back the next day's load and think about adding another recovery session. If HRV comes back up and fatigue drops, you can keep the next day's load on plan.
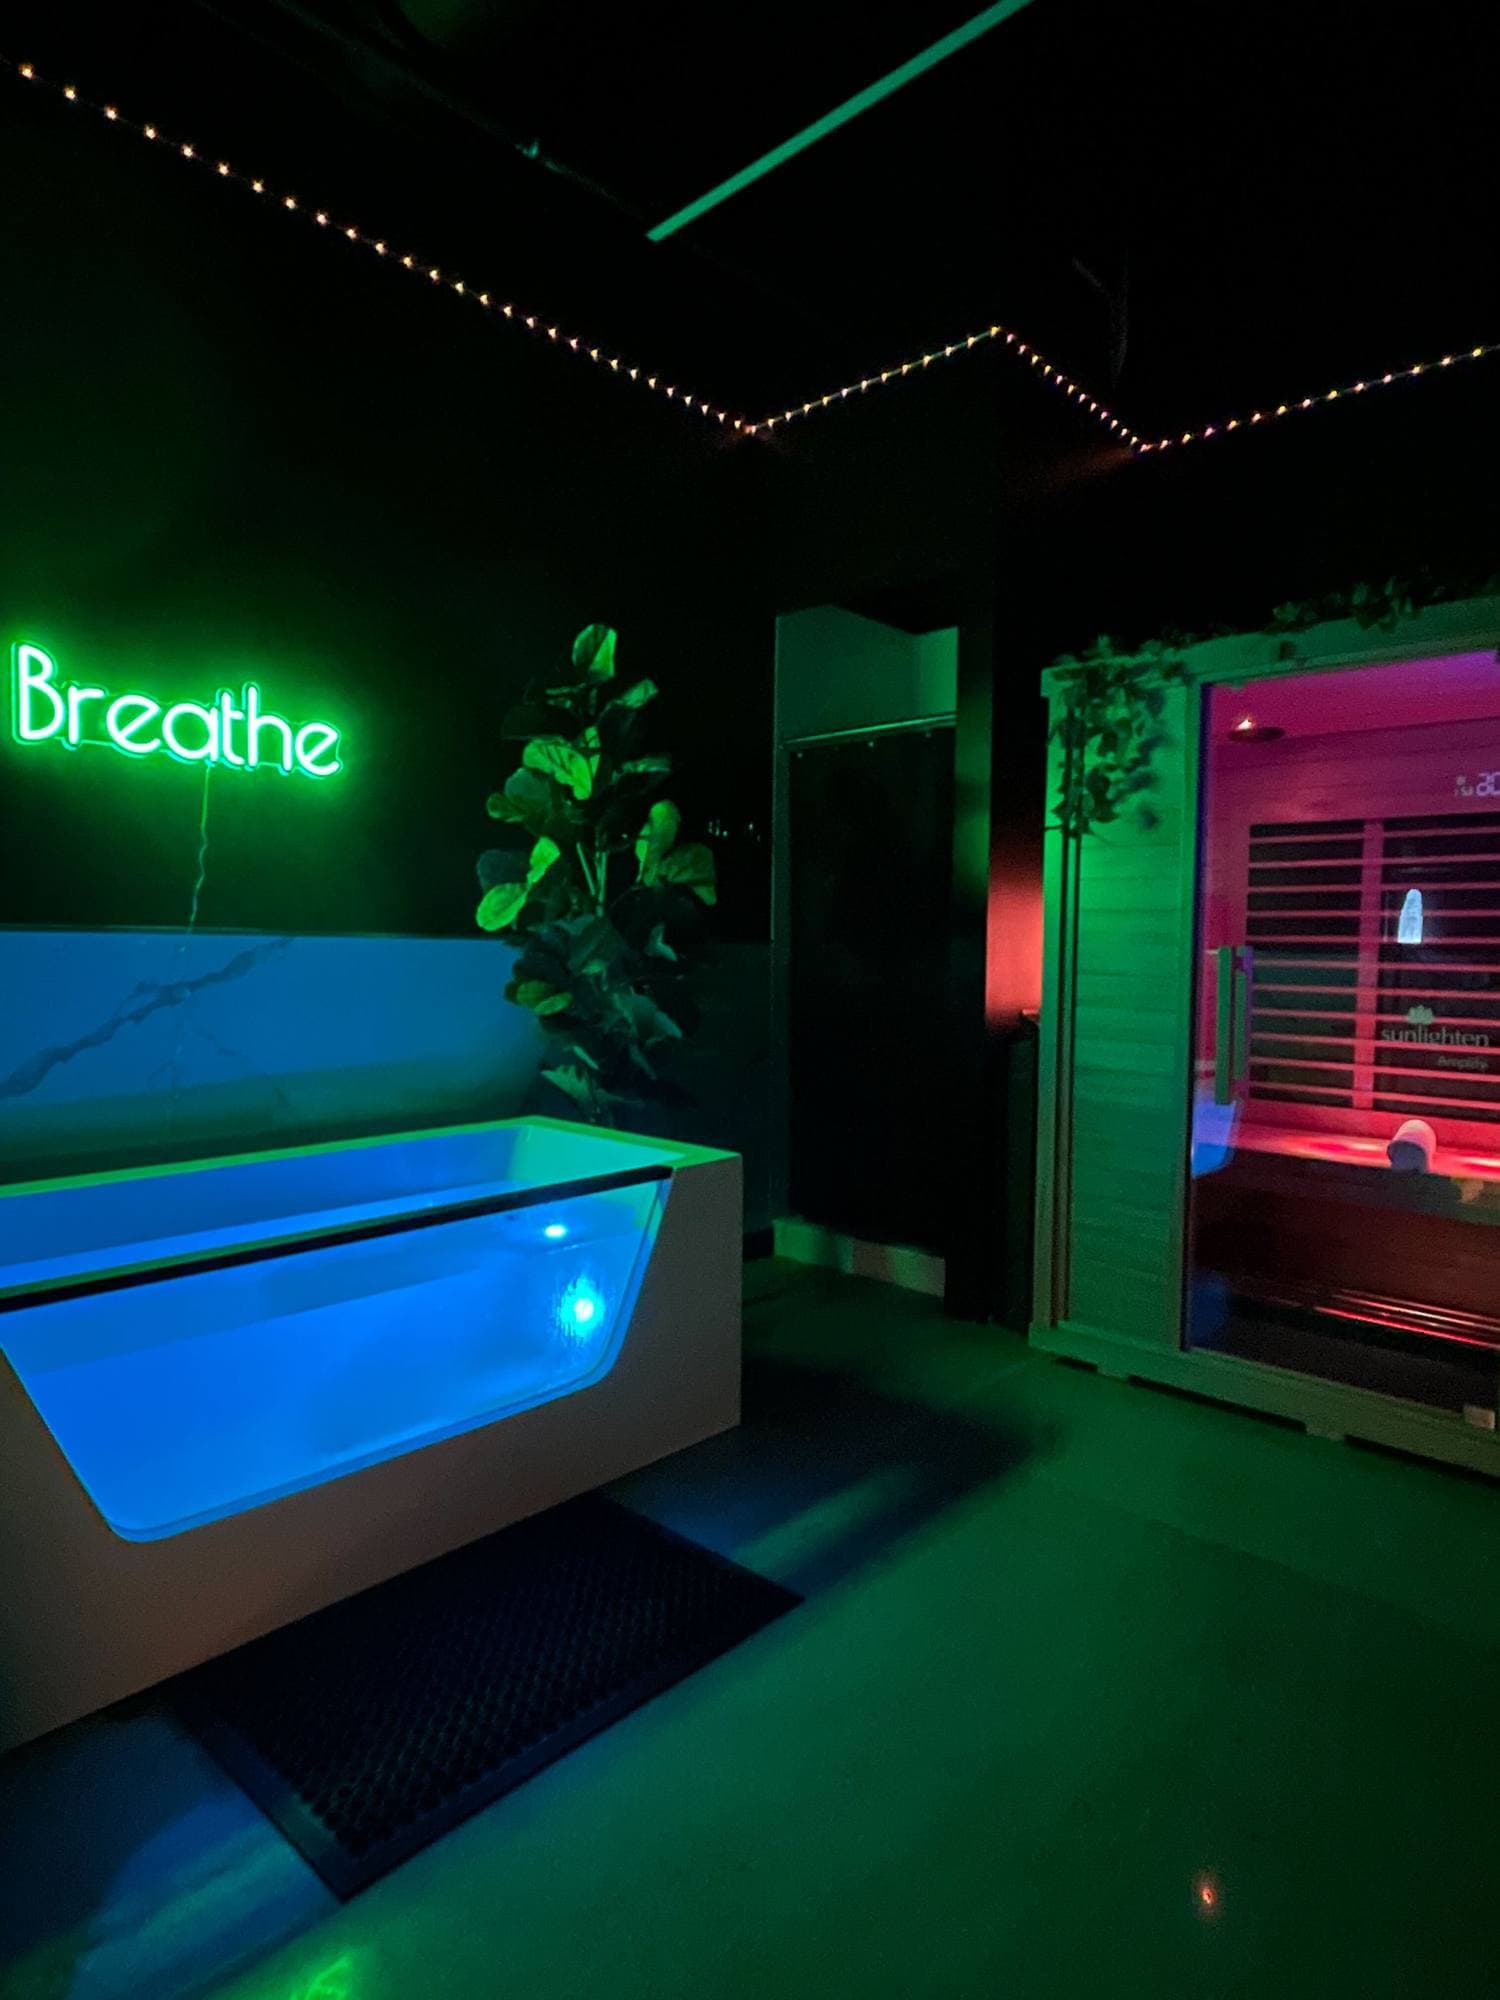
For athletes in San Diego, Conscious Body Recovery offers private infrared sauna and cold plunge sessions in 25-, 55-, or 85-minute options. Use the same pre- and post-session measures every time so you can compare sessions side by side with less noise in the data.
Side-by-Side Comparison of the 5 Metrics
Once you look at each metric on its own, it helps to see them next to each other. That makes the differences a lot easier to spot - where the data comes from, what each metric is meant to tell you, and how a coach might use it in practice.
| Metric | Main Data Source | Type | Common Coaching Action |
|---|---|---|---|
| Heart Rate & Zones | Chest strap / Optical sensor | Internal Load | Keep the session inside the target zone. |
| Heart Rate Variability (HRV) | Wearables / Chest strap | Recovery Status | Use as a daily readiness check; shift to low-intensity work when suppressed. |
| Internal Training Load (sRPE) | Subjective self-report (RPE × duration) | Internal Load | Flag effort spikes that don't match output. |
| External Load | GPS units / Accelerometers | External Load | Track volume, sprint count, and ACWR. |
| Neuromuscular Fatigue (CMJ/Sleep) | Force plates / Sleep trackers | Recovery Status | Cut explosive work if jump height drops or sleep worsens. |
A simple way to think about it: load metrics tell you how much work got done, while recovery metrics tell you how ready the athlete is for what comes next. When those two don’t line up, that’s where coaching decisions start to matter. If workload looks normal but readiness drops, it may be time to pull back. If readiness looks solid but output is climbing fast, you may want to watch the next session more closely.
Conclusion
These five metrics help turn live data into day-to-day coaching calls. The best athlete-specific feedback algorithms don’t just watch output. They track how the athlete responds. Adaptation happens after training, when recovery turns stress into progress. Heart rate, HRV, training load, movement output, and recovery markers and sleep and stress scores each show a different piece of that response. When those signals line up, readiness improves. When they split apart, training needs to change.
Athletes who adjust training to readiness achieve 15% to 20% greater performance gains than those on fixed plans. The goal is simple: use the data to decide when to push, when to cut load, and when recovery comes first - for steadier day-to-day performance. Utilizing tools like saunas and cold plunges can further accelerate this process.
FAQs
Which metric matters most?
No single metric tells the whole story. Athlete monitoring works best when you look for patterns, not when you chase one “perfect” number. A smart approach is to follow a small group of metrics - usually heart rate variability, resting heart rate, and sleep - so you can get a better read on recovery. Heart rate variability can be a sensitive sign of day-to-day readiness, but it only means much when you compare it with your own baseline and read it alongside other data.
How long should I track data before changing training?
Track your data for at least 2 to 4 weeks before you change your training. That gives you a personal baseline based on normal, day-to-day conditions instead of one-off readings. If you use HRV-style readiness to guide training, don’t change course because of a single bad day. Look for patterns that stick around, like 2 to 3 consecutive days of lower HRV, higher resting heart rate, or poor sleep. If you want a more reliable read on your normal range, aim for 6 to 8 weeks of steady morning measurements.
What should I do if my metrics conflict?
Don’t overreact to one data point. Look at patterns across 3 to 5 days to figure out whether you’re seeing actual fatigue or just random noise. The clearest signal shows up when HRV, RPE, and mobility all move in the same direction. If only one metric is off, step back and look at other stuff like sleep, travel, or mental strain. The goal is to watch longer-term trends, not panic over a single dip. And if your scores look low but you still feel good, trust your body. In that case, a light recovery session, like contrast therapy, can make more sense than shutting everything down.